
Page 179 - Chemistry ICSE Class IX
P. 179
Study of Gas Laws 167
How is the Boyle’s law described graphically
According to the Boyle’s law,
PV = Constant
The Boyle’s law relationship is shown graphically as the plots of,
Volume vs Pressure (V vs P)
1 1
or Volume vs (V vs )
Pressure P
or Pressure × Volume vs Pressure (PV vs P)
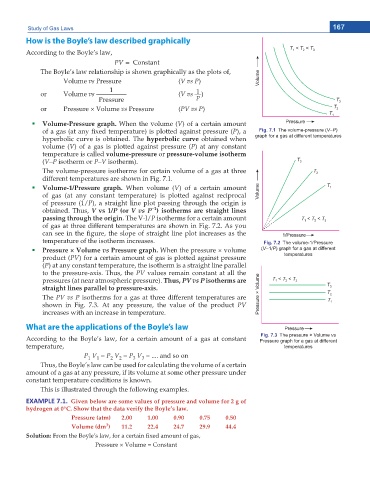
Volume-Pressure graph. When the volume (V) of a certain amount
of a gas (at any xed temperature) is plotted against pressure (P), a Fig. 7.1 The volume-pressure (V–P)
hyperbolic curve is obtained. The hyperbolic curve obtained when graph for a gas at different temperatures
volume (V) of a gas is plotted against pressure (P) at any constant
temperature is called volume-pressure or pressure-volume isotherm
(V–P isotherm or P–V isotherm).
The volume-pressure isotherms for certain volume of a gas at three
different temperatures are shown in Fig. 7.1.
Volume-1/Pressure graph. When volume (V) of a certain amount
of gas (at any constant temperature) is plotted against reciprocal
of pressure (1/P), a straight line plot passing through the origin is
–1
obtained. Thus, V vs 1/P (or V vs P ) isotherms are straight lines
passing through the origin. The V-l/P isotherms for a certain amount
of gas at three different temperatures are shown in Fig. 7.2. As you
can see in the gure, the slope of straight line plot increases as the
temperature of the isotherm increases. Fig. 7.2 The volume-1/Pressure
Pressure × Volume vs Pressure graph. When the pressure × volume (V–1/P) graph for a gas at different
product (PV) for a certain amount of gas is plotted against pressure temperatures
(P) at any constant temperature, the isotherm is a straight line parallel
to the pressure-axis. Thus, the PV values remain constant at all the
pressures (at near atmospheric pressure). Thus, PV vs P isotherms are
straight lines parallel to pressure-axis.
The PV vs P isotherms for a gas at three different temperatures are
shown in Fig. 7.3. At any pressure, the value of the product PV
increases with an increase in temperature.
What are the applications of the Boyle’s law
Fig. 7.3 The pressure × Volume vs
According to the Boyle’s law, for a certain amount of a gas at constant Pressure graph for a gas at different
temperature, temperatures
P V = P V = P V = .... and so on
3
1
2
2
1
3
Thus, the Boyle’s law can be used for calculating the volume of a certain
amount of a gas at any pressure, if its volume at some other pressure under
constant temperature conditions is known.
This is illustrated through the following examples.
EXAMPLE 7.1. Given below are some values of pressure and volume for 2 g of
hydrogen at 0°C. Show that the data verify the Boyle’s law.
Pressure (atm) 2.00 1.00 0.90 0.75 0.50
3
Volume (dm ) 11.2 22.4 24.7 29.9 44.4
Solution: From the Boyle’s law, for a certain xed amount of gas,
Pressure × Volume = Constant